SOLID SOFTWARE SOLUTION FOR MARKET DATA ANALYSIS

Challenge
Develop market analyzer software to provide better data research capacity
Solution
Implement high performing data analysis functionality into an approachable analyzer app
Tech stack
React, Redux, Redux Saga, styled-component
Client
Our customer is a leading East European financial service company, looking for ways of boosting their analytical efficiency of investment processes, deeper market trends screening, and accurate forecasting. They decided to go for ordering a customized marketplace software that would integrate trading and financial services for better real-time market assessment.
Challenge: Develop market analyzer software to provide better data research capacity
Data analysis is vital for providing quality financial and market prospects to investment experts. That’s why creating a solid high-performing market research software is essential for convenient data accessing and processing to conduct a trustworthy market report. To cater to the requirements, a desktop app must be equipped with all the necessary tools for quick, easy, and effective data operations.
The product had to meet the following characteristics:
- real-time market data access and market news arrangement
- aggregation of micro- and macroeconomic information
- access to inner company data, including transitions
- responsive data analyzing tools for various queries
- automatic report feature

Solution: Implement high-performing data analysis functionality into an approachable analyzer app
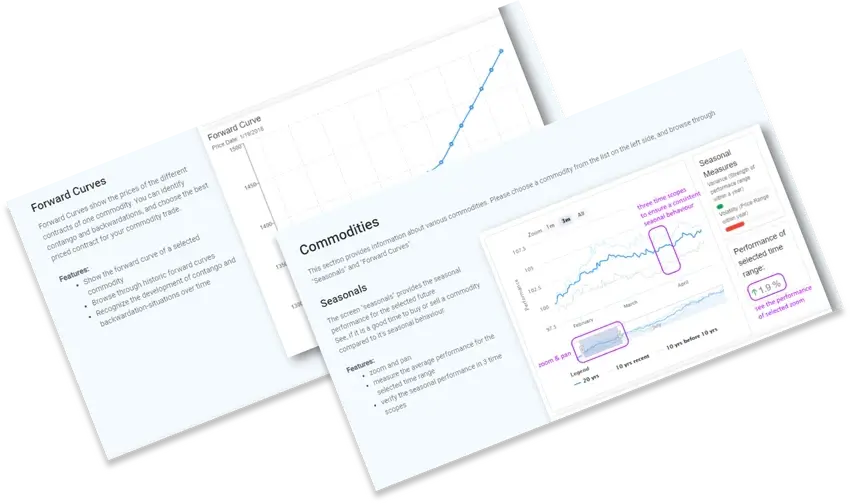
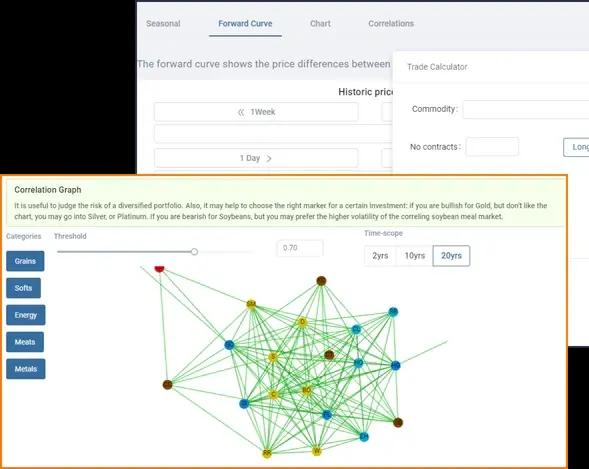
Taking into account the limited amount of time allocated for the market analyzer software development, the team showed great skill and competence in terms of the implemented app functionality. Apart from the robust back-end, the interface is clearly laid-out and easy to navigate. Front-end intuitive navigability was reached due to several highlighted modules, including the Commodities, Spread, Screener, Watchlist, and Trade Calculator units, which are also subdivided into smaller blocks for extra detailed search convenience. The Commodities unit is a tool section containing the following ones:
Apart from the key units, the market research software utilizes a responsive Trade Calculator to count customers’ real and hypothetical profit and wastage, as well as risks and other necessary trade parameters. As a result of the successful collaboration, the client’s benefits include:
- 90% market analysis accuracy
- 30% more detailed investment research capacity
- quick and easy data access
- research download ability
- automated editable data reports